STM32 VS Code Extension + DAPlink实现
DAPLINK
参考文章:
基础环境配置(VSCODE+STM32):
爽!手把手教你用VSCode开发STM32【大人,时代变啦!!!】_哔哩哔哩_bilibili
VSCODE及环境配置:
MacOS环境下,使用VScode + STM32 VS Code Extension + openOCD,通过CMSIS DAP实现在线调试_vscode cmsis-dap-CSDN博客
高版本CubeIDE下使用DAP-LINK教程_cubeide daplink-CSDN博客
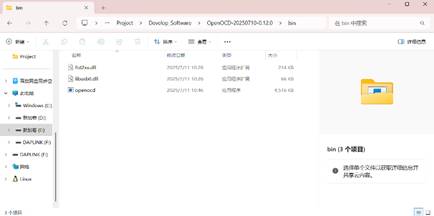
一、下载OpenOCD(可以看上面的两个文章连接)
下载完记一下地址
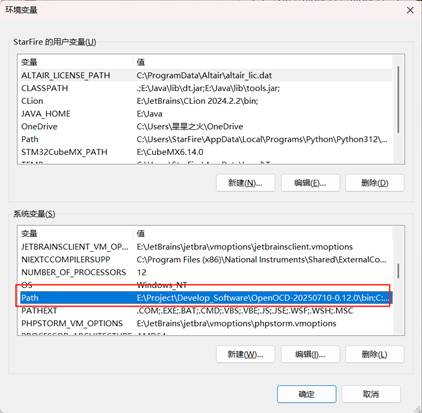
二、编辑系统变量(可以不做,我之前就是在路径这里出现问题)

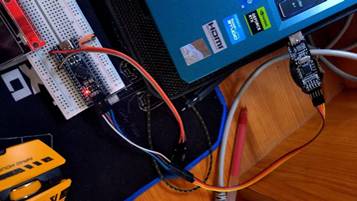
三、检查环境(关键步骤)
现在我们插上单片机+Daplink
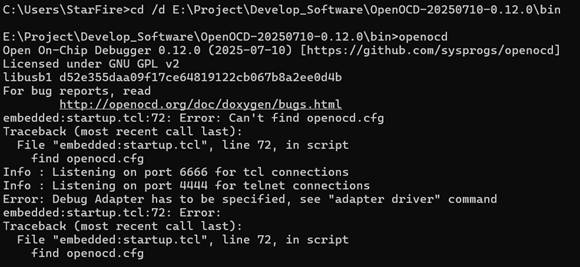
Win+R 输入CMD
进入到openocd的指定路径
输入(自己的路径改一下)
cd /d E:\Project\Develop_Software\OpenOCD-20250710-0.12.0\bin

openocd
出现类似下面的就表示OpenOCD可以动
再输入
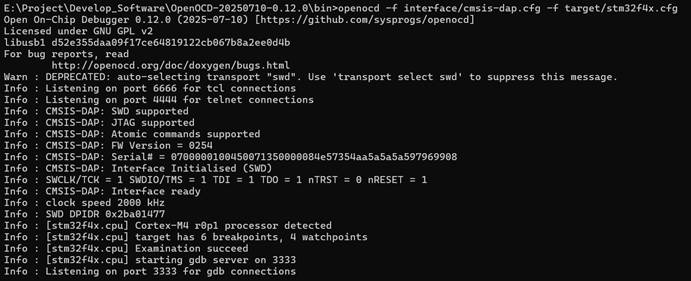
openocd -f interface/cmsis-dap.cfg -f target/stm32f4x.cfg(我的是stm32f411,注意改成自己的型号例如stm32f1x.cfg stm32f3x.cfg)出现类似下面的,能识别到Cortex-M4就表示能找到单片机可以动

现在这个界面不要动他,打开现在单片机烧录程序的工程文件,位于build/debug/.elf(如果没有烧录也继续往下看,可以直接配置最终的环境,顺便烧录进入)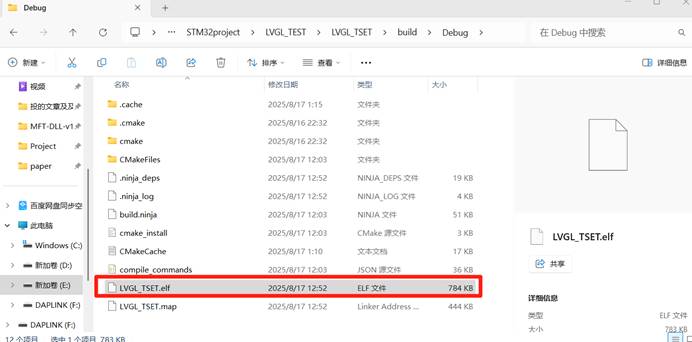
记住这个路径
打开另一个CMD
输入
arm-none-eabi-gdb -ex "target extended-remote localhost:3333" -ex "monitor reset halt" -ex "load" E:/Project/ProjectSTM32/STM32project/LVGL_TEST/LVGL_TSET/build/Debug

LVGL_TSET.elf如果输入的时候没反应,可能需要单独下载arm-none-eabi-gdb,并添加到环境中
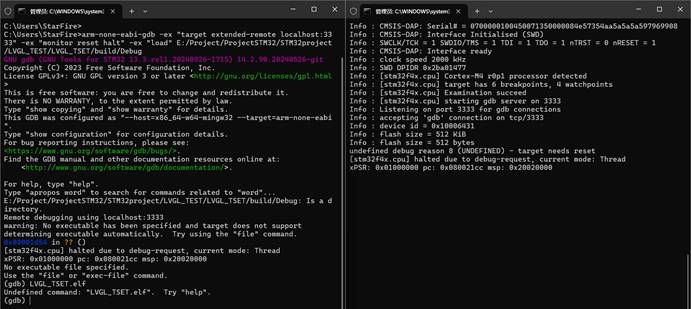
向我左边这种情况就是进入了debug了已经,可以继续输入,玩一下
# 设置断点
(gdb) break main
# 继续运行
(gdb) continue
# 查看寄存器
(gdb) info registers
# 单步执行
(gdb) step
至此环境检查已经完成
四、VSCODE配置
将工程导入VSCODE中,等待插件自动配置完成(参考文章最顶端的参考视频)
在.vscode/launch.json中添加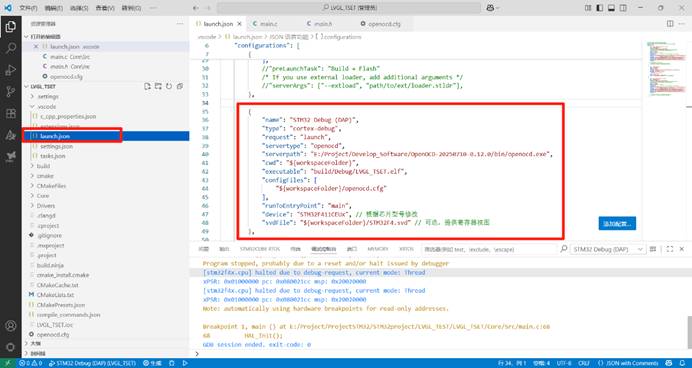
{
"name": "STM32 Debug (DAP)",
"type": "cortex-debug",
"request": "launch",
"servertype": "openocd",
"serverpath": "E:/Project/Develop_Software/OpenOCD-20250710-0.12.0/bin/openocd.exe", // 修改成自己的
"cwd": "${workspaceFolder}",
"executable": "build/Debug/LVGL_TSET.elf", // 修改成自己的
"configFiles": [
"${workspaceFolder}/openocd.cfg"
],
"runToEntryPoint": "main",
"device": "STM32F411CEUx", // 根据芯片型号修改,可去除
"svdFile": "${workspaceFolder}/STM32F4.svd" //提供寄存器视图,可去除
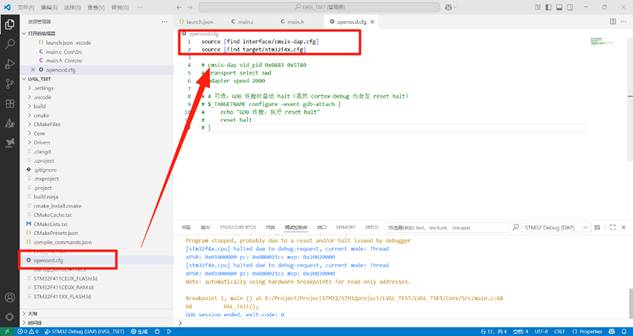
}工程根目录上创建文件openocd.cfg
写入
source [find interface/cmsis-dap.cfg]
source [find target/stm32f4x.cfg]
CTRL+S保存后
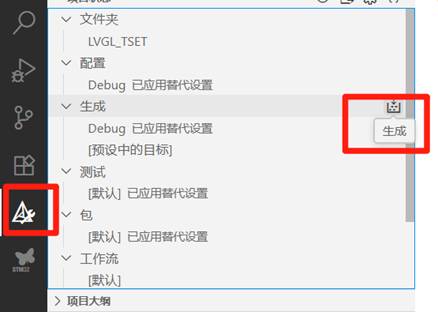
可以先在Cmake编译一下
之后进入调试界面(注意别选错了,是launch.json中的“name”)
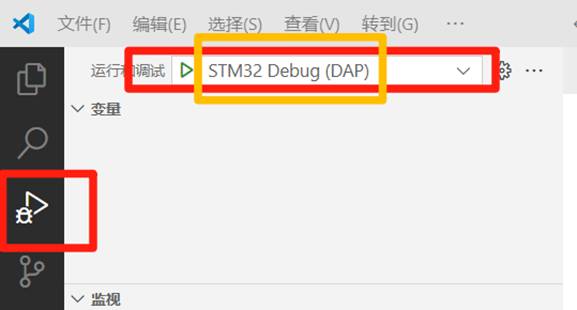
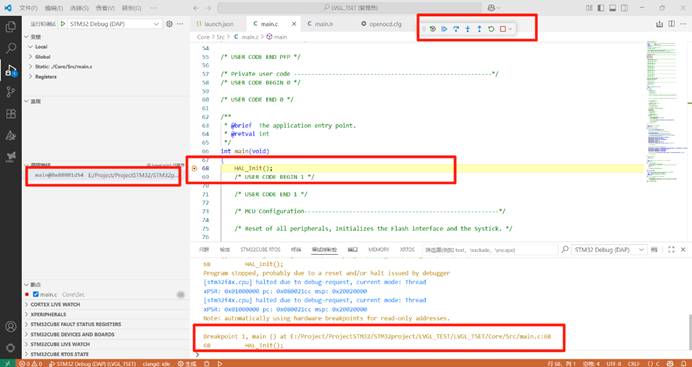
成功烧录并进入Debug
对于Debug进入失败的,显示类似
Program stopped, probably due to a reset and/or halt issued by debugger timed out while waiting for target halted TARGET: stm32f4x.cpu - Not halted Protocol error with Rcmd Failed to launch GDB: Protocol error with Rcmd (from interpreter-exec console "monitor reset halt")
可以先尝试一下使用手动模式:
打开CMD,进入自己的openocd bin
cd /d E:\Project\Develop_Software\OpenOCD-20250710-0.12.0\bin
openocd -f interface/cmsis-dap.cfg -f target/stm32f4x.cfg
成功打开(之后别关闭命令行窗口)
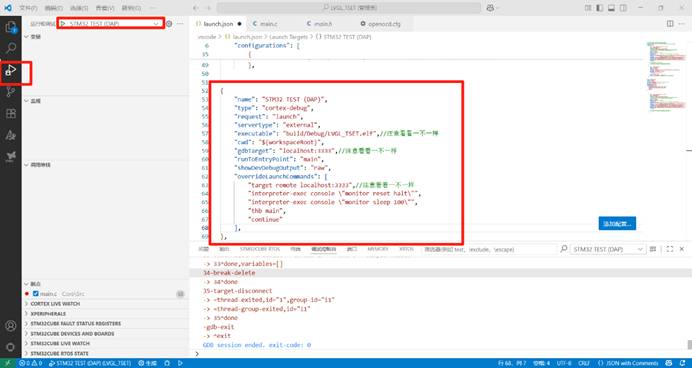
Launch.json中加入
{
    "name": "STM32 TEST (DAP)",
    "type": "cortex-debug",
    "request": "launch",
    "servertype": "external",
    "executable": "build/Debug/LVGL_TSET.elf",//注意看看一不一样
    "cwd": "${workspaceRoot}",
    "gdbTarget": "localhost:3333",//注意看看一不一样
    "runToEntryPoint": "main",
    "showDevDebugOutput": "raw",
    "overrideLaunchCommands": [
        "target remote localhost:3333",//注意看看一不一样
        "interpreter-exec console \"monitor reset halt\"",
        "interpreter-exec console \"monitor sleep 100\"",
        "thb main",
        "continue"
    ],
},
点击开始运行(可能需要多点几次,命令行那边也一样,成功几率不是很大)
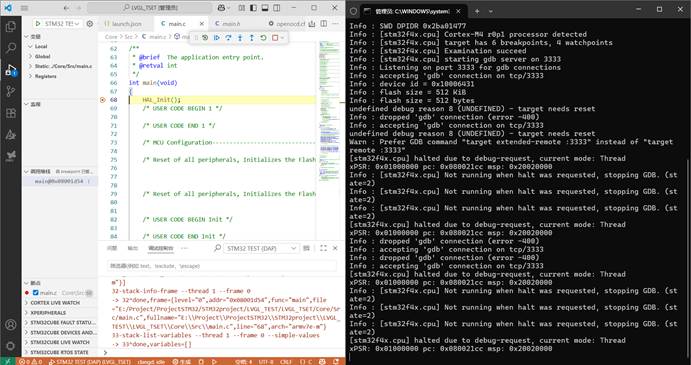
成功进入debug,这样子就表明,我们的环境肯定是可行的,只是launch.json或者openocd.cfg的配置有误,这个得自己慢慢排查。我之前就是困在了这一步,把命令行步骤与vscode。
五、将Cmake+daplink的编译+烧录+Debug进行一体化
将vscode/tasks.json中tasks写上Cmake的build标签
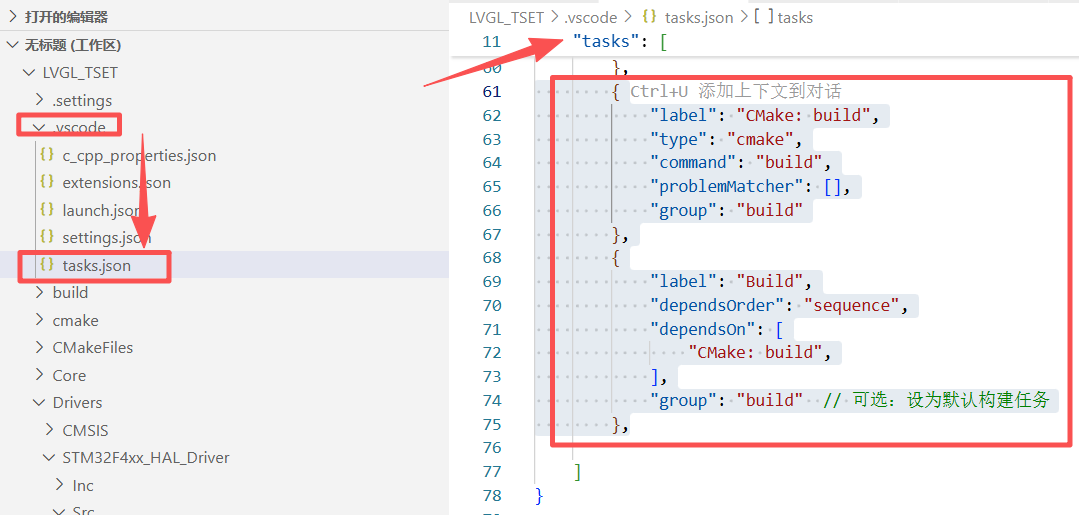
        {
            "label": "CMake: build",
            "type": "cmake",
            "command": "build",
            "problemMatcher": [],
            "group": "build"
        },
        {
            "label": "Build",
            "dependsOrder": "sequence",
            "dependsOn": [
                "CMake: build",
            ],
            "group": "build"  // 可选:设为默认构建任务
        },
在之前修改的launch.json中添加上一行,在调试运行时先进行编译
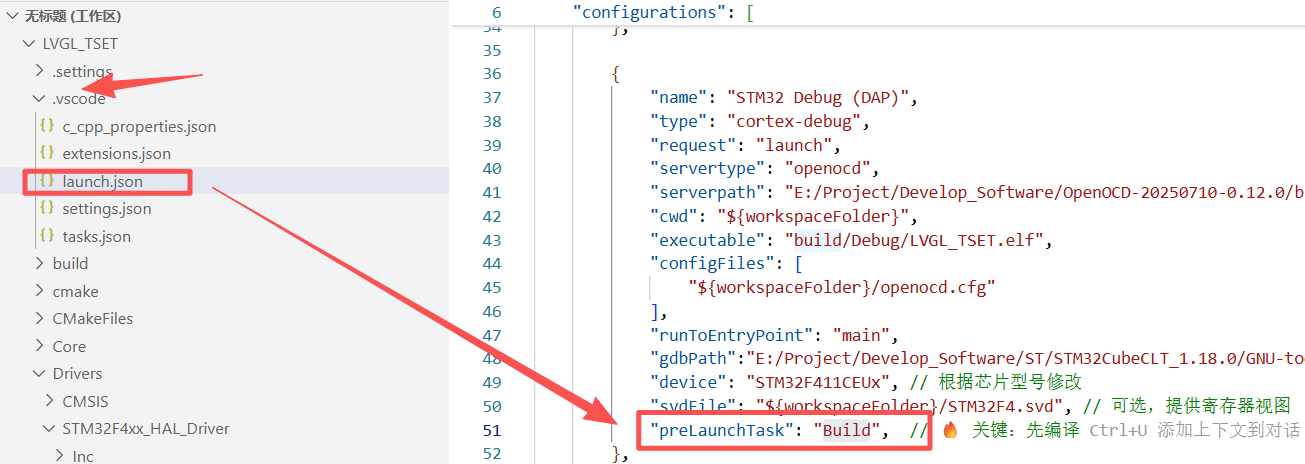
"preLaunchTask": "Build", 
智能硬件社区聚焦AI智能硬件技术生态,汇聚嵌入式AI、物联网硬件开发者,打造交流分享平台,同步全国赛事资讯、开展 OPC 核心人才招募,助力技术落地与开发者成长。
更多推荐


 26
26 0
0- 0


 已为社区贡献9条内容

所有评论(0)